Highlights

Koon Yew Yin's Blog

Author: Koon Yew Yin   |   Latest post: Thu, 18 Apr 2024, 10:35 AM


AYS price chart is up trend - Koon Yew Yin

Author:   |    Publish date:


The below AYS stock price chart is showing 20 ema cuts 70 ema which is a confirmation of uptrend (look at the blue line). Moreover, the traded volume of the stock is also quite good. The daily MACD and weekly MACD are showing a good buy signal. I am sure the stock price of AYS will fly high soon. The next support is 0.448 and the resistance is 0.47.

With the increasing construction activities after the Covid 19 pandemic lockdown is over and the rising steel prices as shown below, the 47 sen resistance should be broken easily. 

Share this
Labels: AYS

Related Stocks

Chart Stock Name Last Change Volume 
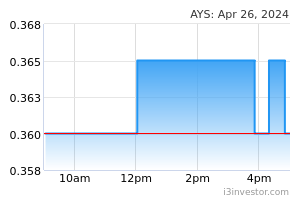
AYS 0.365 -0.005 (1.35%) 229,900 

  Be the first to like this.
 
speakup Ya gah?
15/11/2022 9:22 AM
emsvsi DEAR KOON
IF YOURE SELLING AYS NOW WHAT ARE YOU BUYING NOW
15/11/2022 10:44 AM
arv18 he is selling now. push up for 10-14 trading days, then dump. seen this before.
18/11/2022 4:32 PM
orborne Every time we see a stock chart rising rapidly, we feel very happy. https://wordle-unlimited.co/
12/12/2022 3:50 PM


APPS
I3 Messenger
Individual or Group chat with anyone on I3investor
MQ Trader
View Trading Signals and run Live Backtest
MQ Affiliate
Earn rewards with MQ Affiliate Program


328  714  581  750 

ActiveGainersLosers
Top 10 Active Counters
 NameLastChange 
 HSI-CVM 0.125-0.025 
 HSI-CVH 0.205-0.025 
 HSI-HUE 0.165+0.01 
 TWL 0.030.00 
 HSI-CVA 0.065-0.02 
 BPURI 0.080.00 
 HSI-HSY 0.205+0.03 
 VELESTO 0.275+0.005 
 MYEG 0.77-0.01 
 AWANTEC 0.22-0.10 
PARTNERS & BROKERS