Downgrade to Underweight from Neutral. Indications from our supply-demand analysis are pointing towards excess capacity in the sector spanning the next two years. Hence, we expect the weak operating environment to continue to weigh down glove makers over the medium term to long-term. Specifically, industry leader TOPGLOV’s recently released results are already indicating weaker earnings ahead for glove makers suggesting that earnings have yet to bottom out. This is due to crimped margins arising from the mismatch between ASP and inability to fully past cost through, further exacerbated by low industry plant utilization averaging 50-60% which appears to likely persist over the medium term. The situation is further aggravated by the softening demand as evident from the low utilization rate of glove players leading to oversupply putting pressure on ASP coupled with customers’ reluctance to commit to sizeable orders as they expect selling prices to ease further. Our ratings are as follows: HART (MP; TP: RM2.90), TOPGLOV (UP; TP: RM0.80), KOSSAN (UP; TP: RM1.25) and SUPERMX (UP; TP: RM0.65).
Excess supply and low utilization to weigh down on earnings. We expect ASP to remain in the doldrums in 2H 2022. As a result of massive capacity expansion by incumbent players as well as new players during the pandemic years — enticed by the super fat margins that had eventually evaporated — we estimate that the global glove manufacturing capacity has jumped by 22% to 511b pieces in 2022 (see chart on the following page). On the other hand, as more countries come out the other end of the pandemic, we project the global demand for gloves to ease by 10% in 2022 to 387b pieces (partly also due to the destocking activities along the distribution network). This will result in an excess supply of 124b pieces (assuming, hypothetically, capacity utilisation is maximised). In 2023, we estimate that the global glove manufacturing capacity to surge by another 16% to 595b pieces (as more capacity planned during the pandemic years finally comes on-line) while the global demand for gloves shall resume its organic growth of 15% annually (taking our cue from MARGMA’s projection of 10-15% growth in global glove demand yearly), resulting in the excess supply rising further to 150 b pieces. Based on our estimates, the demand-supply situation will only start to head towards equilibrium in 2025 when there is virtually no more new capacity coming onstream while the global demand for gloves continues to rise by 15% per annum underpinned by rising hygiene awareness.
All in, the industry excess supply could well mean that glove players have less pricing power to pass costs through and the situation is further aggravated by low industry utilization rate putting pressure on margins. The recent round of results reported by glove makers suggested that glove makers’ earnings have yet to bottom with ASP expected to continue declining with the low plant utilization averaging 50-60% likely to persist over the medium term amidst intense competition. The situation is further aggravated by the softening demand as evident by the low utilization rate of glove players leading to oversupply putting further pressure on ASP coupled with customers’ reluctance to commit to sizeable orders as they expect selling prices to ease further. Based on the results announced by glove players, the followings are our observations:- (i) players are unable to fully pass on the cost increase due to the current oversupply situation which is expected to remain challenging; (ii) apart from reduced economies of scale arising from volume that is less than optimum on the back of the soft demand evident from the low utilisation rate, glove players are experiencing margins erosion as raw materials costs are not adjusting down as fast as ASP; (iii) ASP over the short to medium term could be lower than pre-pandemic level due to the current supply-demand imbalance as evident in historically low utilization of 50-60% but some players see margins bottoming; (iv) current industry utilisation rate of 50-60% is expected to put brakes on excessive new capacity of which in our view is expected to put some near-term pressure on ASP; and (v) in terms of M&A – the players under our coverage have been approached by potential sellers but lack urgency given the excess industry capacity.
Downgrade to Underweight from Neutral. We revise our ASP, margin and utilisation assumptions for TOPGLOV, SUPERMX, KOSSAN and HARTA.
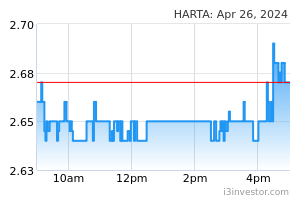
HARTA (Downgrade to MP; TP: RM2.90): Our FY22E/FY23E net profits are downgraded by 37%/39%; (i) FY23E – ASP cut to USD23 from USD25 per 1,000 pieces; EBITDA margin cut to 18% form 20% and utilisation to 70% from 85%; and (ii) FY24E – ASP cut to USD21 from USD23 per 1,000 pieces and reduce EBITDA margin assumption to 20% from 22% and utilisation to 72% from 90%. Correspondingly, we downgrade our TP from RM5.60 to RM2.90 based on 25x CY23E EPS in line with its bigger peers’ average.
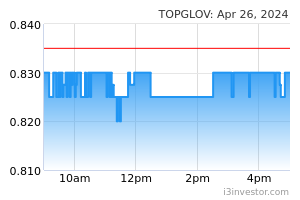
TOPGLOV (UP; TP: RM0.80). Our FY22E/FY23E net profits are downgraded by 2%/15%; (i) FY22E EBITDA margin reduced to 12% from 13%; and (ii) FY23E ASP cut to USD21 from USD23 per 1,000 pieces; EBITDA margin cut to 13% from 14% and utilisation to 65% from 85%. Correspondingly, we downgrade our TP to RM0.80 from RM0.95 based on 22x FY23E EPS, in line with peers’ average of 21x largely to reflect its bigger market capitalisation.
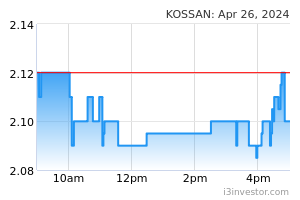
KOSSAN (UP; TP: RM1.20). Our FY22E/FY23E net profit is downgraded by 26%/26% as we cut our ASP assumption from USD26/25 to USD23/21 per 1,000 pieces and reduce EBITDA margin assumption from 18%/18% to 16%/16%. Correspondingly, we downgrade our TP from RM1.60 to RM1.20 based on 13x FY23E EPS, 35% discount to peers’ average of 21x to reflect its smaller market capitalisation.
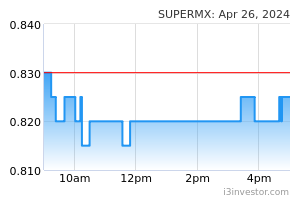
SUPERMX (UP; TP: RM0.65). Our FY23E net profit are downgraded by 16%; (i) ASP cut from USD24 to USD22 per 1,000 pieces and reduce EBITDA margin to 14% from 18%. Correspondingly, we downgrade our TP from RM0.75 to RM0.65 based on 13x FY23E EPS, at 35% discount to peers’ average of 21x largely to reflect its smaller market capitalisation.
Source: Kenanga Research - 23 Jun 2022