Dayang Enterprise Holdings Bhd (Trading Buy)
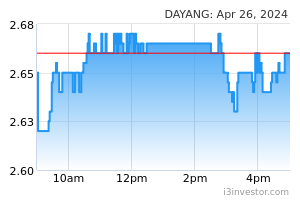
• Chart-wise, DAYANG’s share price has slipped from a high of RM1.42 in May 2021 to a low of RM0.775 (-45%) in December 2021 before climbing gradually to as high as RM1.02 in February 2022. The stock then saw renewed selling pressure before entering into a consolidation phase. Following a close above the upper boundary (of RM0.94) of the consolidation pattern yesterday, the stock could be in the midst of staging a breakout ahead.
• We believe the increased buying interest in the stock will likely sustain on the back of the positive technical signals arising from: (i) the rising Parabolic SAR indicator, (ii) the MACD trending higher and above the zero-line, and (iii) the DMI Plus widening its gap from the DMI Minus.
• Thus, the stock could rise to challenge our resistance levels of RM1.07 (R1; 11% upside potential) and RM1.35 (R2; 41% upside potential).
• We have pegged our stop loss at RM0.87, which represents a downside risk of 9%.
• Business-wise, DAYANG provides offshore topside maintenance services, minor fabrication works and offshore hook-up and commissioning services for oil and gas companies.
• For its recent results, the group’s core net profit plunged by 78% QoQ from RM42.7m in 4QFY21 to RM9.3m in 1QFY22 no thanks to its offshore works being hampered by the monsoon. However, YoY, 1QFY22 saw a jump from a net loss of RM34.5m in 1QFY21 to a core net profit of RM9.3m as the reopening of borders led to a revival of work orders. Reflecting this, the group’s vessel utilization rate improved by 5ppt to 25% YoY.
• Moving forward, on the back of elevated oil prices and an improved business outlook (backed by Petronas’ latest activity outlook for 2022 till 2024), consensus is expecting the group to record higher net profit of RM63.2m in FY Dec 22 and RM85.6m in FY Dec 23. This translates to forward PERs of 17.5x this year and 13.0x next year, respectively.

Global Oriental Bhd (Trading Buy)
• From a peak of RM0.45 in June 2021, GOB shares plunged to a low of RM0.185 (-59%) on 19 May 2022. Subsequently, the stock saw a back-to-back gap up in the past two trading days to be back to where it was in October 2021, recovering its previous losses along the way.
• With increased trading volume (as indicated by the recent uptick in the OBV indicator) backing the price reversal (which has crossed above both the key 20-day and 50-day SMAs), the rising MACD momentum suggests that the stock will likely strengthen further to challenge our resistance levels of RM0.345 (R1; 13% upside potential) and RM0.395 (R2; 30% upside potential).
• On the downside, our stop loss price has been set at RM0.27, which translates to a downside risk of 11%.
• Business-wise, GOB is primarily engaged in the property development activity with a geographical presence in Malaysia and China. The group derives most of its revenue from the Malaysian region (which focuses on property development, construction, trading and distribution, investment holding and others).
• For 9MFY22, the group recovered from losses of RM6.1m in 9MFY21 to a net profit of RM7.5m thanks to lower operating expenses and lower finance costs.
• Recently, the group has formed a joint venture with Tokyo-listed Sojitz Corp to launch the first Tsutaya Books outlet in Malaysia at Pavilion Bukit Jalil as part of its diversification plan.
• Valuation-wise, based on its book value per share of RM0.60 as of end-December 2021, the stock is currently trading at a Price/Book Value multiple of 0.51x (or close to 2SD above its 5-year historical mean).
Source: Kenanga Research - 24 May 2022