Investment Highlights
- ASP resume downtrend in Dec. Following relative average selling price (ASP) stabilisation over the past 3 months (SepNov 2022), we expect glove makers under our coverage to slip into or widen losses especially over the upcoming 2 quarters (ie. 4QCY22F and 1QCY23F) mainly due to further declines in ASP in Dec 2022, based on channel checks with glove makers recently. This is worsened by the elevated operating costs (opex), especially natural gas (YTD: +60-65%) and lower economies of scale as a result of sub-optimal plant utilisation rate. Nevertheless, we believe some price improvements could start in 2QCY23F, driven by customer replenishment cycle.
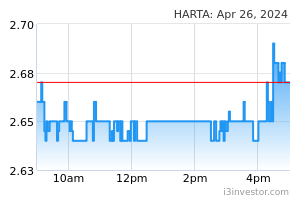
- Stabilised ASP in Sep-Nov. From Hartalega’s result briefing in Nov 22, Hartalega guided that normal nitrile rubber medical glove ASP has stabilised at US$20/1K pcs for 3 consecutive months (Sep-Nov 22). Based on our recent checks, we gathered that the latest ASP in Dec 22 has dropped to the range of US$17-19/1K pcs, primarily because glove makers want to maintain their utilisation rates as customers compare prices against Chinese glove makers, who are quoting in the range of US$14-15/1K pcs.
Despite Malaysia’s medical rubber glove quality being superior to China’s, an 18-21% discount is attractive enough for end-customers to source from China, especially European customers who are less concerned on geopolitical risks such as the US-China trade war. All in, we believe that the continued declines in ASP and utilisation rate pose heightened risks that the inventory replenishment cycle could materialise later than 2QCY23F.
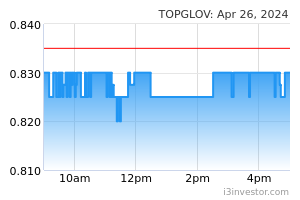
- Overcapacity amid rising costs, heading towards losses. Continued intense competition among regional glove makers stemming from overcapacity and low demand has led to a downward ASP spiral from its peak in 2Q2021. Furthermore, rising operating costs (energy and labour costs) has driven the world largest glove maker, Top Glove, into its maiden loss since listing in 4QFY22. We expect Hartalega and Kossan will slip into losses in the coming 2 quarters (ie. 4QCY22F and 1QCY23F), whereas Top Glove will widen its losses in the coming 2 quarters, before improvements could earliest be seen in 2QCY23F onwards.
- Waiting for stock replenishment cycle. From demand perspective, we gathered from the 3 glove makers under coverage that end-customers’ rubber glove stock level is depleting albeit sitting at a high 3-4 months of inventories (until end- 1QCY23F), leading to waning purchase orders in 4QCY22F and 1QCY23F. On a positive note, the 3 glove makers guided that customers may start restocking in 2QCY23F onwards. Hence, we believe improvements could only be seen earliest in 2QCY23F onwards.
As a result of weak demand, the industry's plant utilisation rate is running at 30%–50% in 3QCY22 (versus an optimal rate of 80%–85%) and we believe this low utilisation will continue until 1QCY23F. This may result in higher operating expenses due to a lower economies of scale. All in, we anticipate a 15% decline in glove demand in 2022 (Exhibit 3), based on annualised global glove demand in 8M2022 (-19% YoY) and the combined 9M2022 sales for the 3 glove makers under our coverage, which fell 12% YoY. Comparatively, MARGMA forecasts a growth rate of 10–12% YoY, which we believe is overly optimistic.
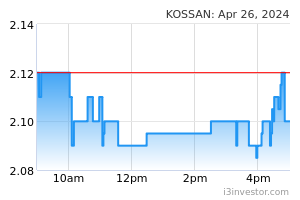
- 3Q2022 earnings were generally mixed. Out of the 3 glove makers under our coverage, Top Glove beat 3Q2022 expectations while Hartalega met ours, but missed consensus’. Meanwhile, Kossan missed both our and market expectations (Exhibit 2). Top Glove’s higher-than-expected result was mainly due to the group disclosing a one-off cumulative RM229mil inventory write-downs in 4QFY22, which boosted FY22 core net profit. Separately, Kossan missed expectations mainly due to a faster-than-expected drop in ASP amid rising operating costs. Lastly, Hartalega’s core net profit was in line with our expectation, coming in 2% below our full-year forecast as we anticipated break-even or marginal losses over the coming 2 quarters. However, Hartalega’s 1HFY23 core net profit was significantly below consensus, making up only 42% of street’s estimates.
- Scaling back capacity expansions. Glove makers have unanimously announced a scale-back of capacity expansions over the coming months. Hartalega guided that the 1st line of NGC 1.5, with total annual capacity of 19bil pieces, will be delayed from the original commissioning date in Oct this year. Also, Hartalega is working to decommission some inefficient lines to cut costs.
Similarly, Top Glove revised downwards its original ambitious expansion plan of achieving total annual capacity of 204bil pieces to 115bil pieces in Dec 2025. Moreover, Kossan guided the deferral of near-term capacity expansion plans in adapting to market conditions and curtail excess supply. We believe this combined scale-backs could relieve some supplyside pressure in the glove industry.
- Strengthening RM bane to glove makers, impact differs among players. MYR has strengthened against US$ by 7%- 8% since early Nov 2022. This will be detrimental to export-oriented glove makers, as >90% of their revenue is denominated in US$. However, the impact on glove makers varies according to the magnitude of hedging arrangements. Based on our estimates, for every 10% strengthening of MYR against US$, the impact on FY23F core earnings will be 0.5%-1.0% for Hartalega, 1.3%-1.5% for Kossan and 11%-13% for Top Glove. The minimal impact to Hartalega and Kossan were mainly due to these 2 glove makers having hedged most of their foreign exposures while Top Glove does not.
- Lowered earnings and fair values. Given lower ASP expectations, we cut the fair value (FV) for Hartalega Holdings (Hartalega) to RM1.59/share (from RM1.87/share) from reduced FY23F-25F earnings by 15%/41%/39% with lower ASP assumptions, after learning that product mix in the upcoming quarters would feature lower ASPs. The FV, which incorporates a 3% premium to reflect our unchanged ESG rating of 4 stars, is based on FY24F PE of 26x, at parity to its 10-year average.
Likewise, we reduce Kossan Rubber Industries’ (Kossan) FV to RM1.00/share (from RM1.19/share) from reduced FY23F- 25F earnings by 17%/4%/4% and based on FY23F PE of 17x, at parity to its 10-year average. There is no ESG-related adjustment based on our 3-star rating.
We maintain Top Glove’s FV of RM0.60/share which is based on more conservative ASP assumptions when the results were announced earlier in September amid still declining glove prices.
- We reiterate our NEUTRAL stance on the glove sector with SELL call for Top Glove and HOLDs for Hartalega and Kossan given the continuing supply-demand imbalance over the next 2 quarters.
Source: AmInvest Research - 13 Dec 2022