Highlights

AmInvest Research Reports

Author: AmInvest   |   Latest post: Fri, 19 Apr 2024, 10:14 AM


Stocks on Radar - Kumpulan Fima

Author:   |    Publish date:


Kumpulan Fima broke out from its 3-week rectangle pattern with a long white candle on Friday, implying that a bullish reversal sign may have occurred. The 20-day EMA is turning upwards while the 50-day EMA has a positive slope, suggesting additional strength may be present in the coming sessions. A bullish bias may emerge above the RM2.60 level, with a stop-loss set at RM2.46, below the 50-day EMA. Towards the upside, the near-term resistance level is seen at RM2.86, followed by RM3.00.

Entry : RM2.60–2.66

Target : RM2.86, RM3.00

Exit : RM2.46

Source: AmInvest Research - 4 Jul 2022

Share this
Labels: KFIMA

Related Stocks

Chart Stock Name Last Change Volume 
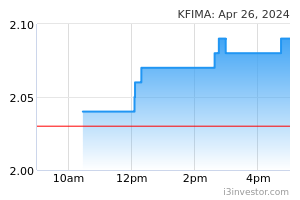
KFIMA 2.01 -0.01 (0.50%) 105,300 

  Be the first to like this.


APPS
I3 Messenger
Individual or Group chat with anyone on I3investor
MQ Trader
Stock Screener using Technical and Fundamental criteria
MQ Affiliate
Join the MQ Affiliate Program today to earn rewards


328  714  581  750 

ActiveGainersLosers
Top 10 Active Counters
 NameLastChange 
 HSI-CVM 0.125-0.025 
 HSI-CVH 0.205-0.025 
 HSI-HUE 0.165+0.01 
 TWL 0.030.00 
 HSI-CVA 0.065-0.02 
 BPURI 0.080.00 
 HSI-HSY 0.205+0.03 
 VELESTO 0.275+0.005 
 MYEG 0.77-0.01 
 AWANTEC 0.22-0.10 
PARTNERS & BROKERS